
One of the strengths of the recently released NC Transportation Safety and Public Health Data Dashboard is its ability to leverage data from multiple sources, allowing for a deeper understanding of pressing public health issues. In this first installment of our new series, Stories from the dashboard, we will discuss how the dashboard was utilized to better understand COVID-19’s impact on motor vehicle crash (MVC)-related injuries in North Carolina.
The first of North Carolina’s 1.47 million COVID-19 cases was detected on March 3rd, 2020. Since then, numerous policies have been enacted to slow the spread of the virus and ease its burden on the state’s medical systems, several of which were focused on reducing travel. The COVID-19 & Crashes panel of the dashboard collects monthly emergency department (ED) visits related to COVID-19 or MVCs from NC DETECT and statewide vehicle miles traveled (VMT) estimates from UNC’s Highway Safety Research Center from January 2019 through July 2021.
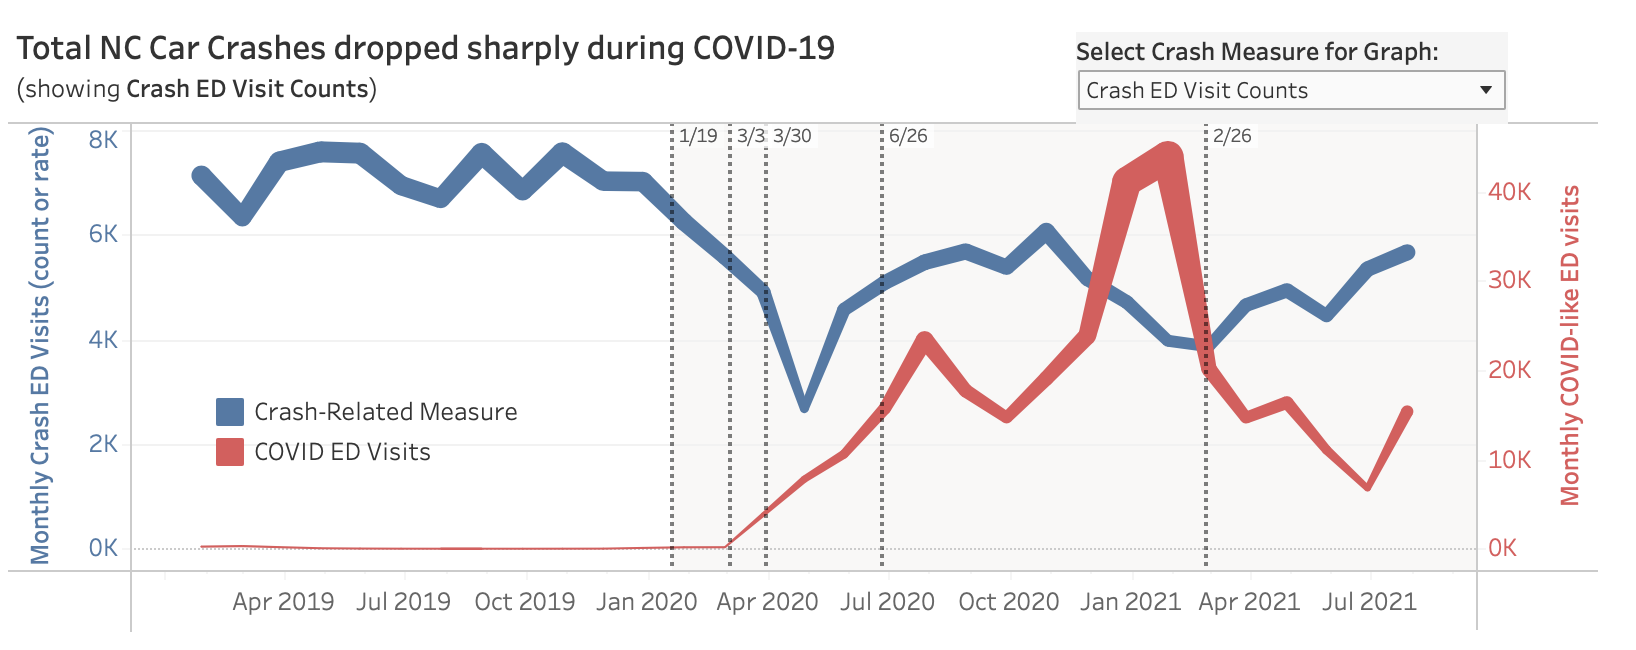
Plot of motor vehicle crash-related and COVID-related emergency department from the NC Transportation Safety and Public Health Data Dashboard.
Useful comparisons that can be made through the dashboard include:
- Monthly counts of MVC-related visits before and after the spread of COVID-19 to the United States and North Carolina: Through the plot we can see that from January 2020 to July 2021, monthly MVC-related ED visits remain well below 2019 levels.
- Monthly counts of MVC-related visits before and after the implementation of COVID-19-related policies: For example, we can see the largest decrease in visits month to month was from 4,908 in March of 2020 to just 2,672 in April 2020. This was likely due, in part, to the implementation of North Carolina’s “stay at home order”, which has been associated with decreased mobility and MVCs in other states, as well (Connecticut, Ohio, Pennsylvania).
- The trends of monthly ED visits related to COVID-19 versus MVC-related visits: When overlayed on the same plot, we can see differences in trends between the two visit types.
- The monthly rate of MVC-related ED visits per 100,000 VMT: These trends are similar to the monthly counts described above. While the overall rate of MVC-related visits is down, the rate of fatal crashes increased following the spread of COVID-19. The National Highway Traffic Safety Administration has highlighted impaired driving, speeding, and lack of seatbelt use as factors related to this increase.
If you find this information interesting, we recommend trying the dashboard for yourself!
NC DETECT authorized users interested in further investigation of these trends can do so within the web application. Additionally, our recently published article entitled “The impact of the COVID-19 pandemic on the utilization of emergency department services for the treatment of injuries” is a great jumping off point for more information on injury-related ED visits in the time of COVID-19.